My 7 hills: GeoJSON and 3D printing
tl;dr: I converted Lon, Lat polygon data into a 3d print, and you can, too!
I adore San Francisco’s hills and would love to better incorporate their geometry into ongoing art projects. While I was unable to find high-resolution STL files of either San Francisco’s topography or individual hills, the SFData site has an elevation map with five feet of resolution.

This elevation map is a geojson file of Polygons and lines, with each point indicated as (Longitude, Latitude) coordinates. Regrettably, the conversion of GeoJSON to STLs is challenging to generalize: First, GeoJSON does not specify the “normals” (i.e. which side is “inside” and which side is “outside”), also lines do not necessarily form closed surfaces.
Not to panic — perhaps we can start with the simple geometry of hills formed by closed polygons and later figure out how to make use of line data.
Step 1: Programmatic Hill Identification & SVG export
Let’s find hills that rise on all sides (vs. flatten into a higher plateau):
- We select all of the polygons within a (Lon, Lat) window
- Sort polygons by z-index / vertical layer, and iterate from the highest to lowest z-index / layer:
- If a point on polygon A at a given z-index Z is on polygon B at z-index Z-1, the polygon B considers polygon A a “leaf.” (I.e. Leaf polygons sit on top of other polygons)
- Assuming no overhangs, if any point on polygon A at z-index Z is not on any polygon at z-index Z-1, the current polygon is a “root”
We assume no overhangs, and that the hill rises slowly enough such that every z-layer has new polygon coordinates. This process gives us a number of root nodes with leaves (which in turn may have other leaves), which constitute our hills.
Let’s render these and sanity check our results by exporting to SVG. SVG is written as plain text XML, and a polygon is simply a list of X,Y points in which the first point is equal to the last point.


Perhaps the simplest way to print this in 3D is to turn each polygon into a “wall” of fixed height, and stack these walls vertically.
Fortunately, the SFData GeoJSON file specifies the layer height in feet, and the Haversine formula reveals the real-world length and width from the Longitude and Latitude of our Polygon data. Once these are converted into the same units (offset from a reference point in meters), we can scale every point of every line to X, Y, Z coordinates.
Step 2: Export to STL and Print
We now have concentric polygons of varying heights (i.e. Z-values). I would like to turn each of these into walls by drawing vertical planar shapes. We can semi-trivially do this by hand:
STL Files are just lists of triangles called “facets,” each of which has three vertices with X,Y,Z coordinates.
facet normal ni nj nk outer loop vertex v1x v1y v1z vertex v2x v2y v2z vertex v3x v3y v3z endloopendfacet
In order to create a vertical “wall” between two polygon points, we draw two complementary triangles — one pointing to the top, and one pointing to the bottom. The surface normal can be computed from the cross product of the triangle (right hand rule!)

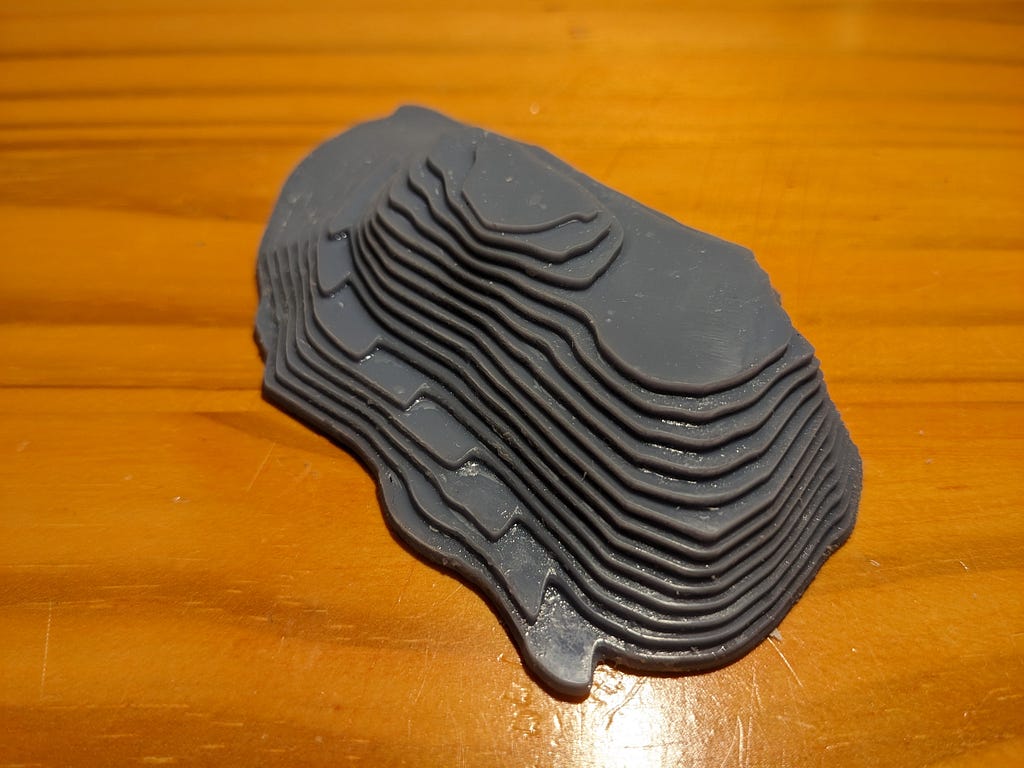
The astute reader may note that the polygon walls do not form a closed surface — meaning, there is no “top” to the mountain. Thankfully, my slicer is forgiving in this regard and Telegraph Hill printed reasonably well.